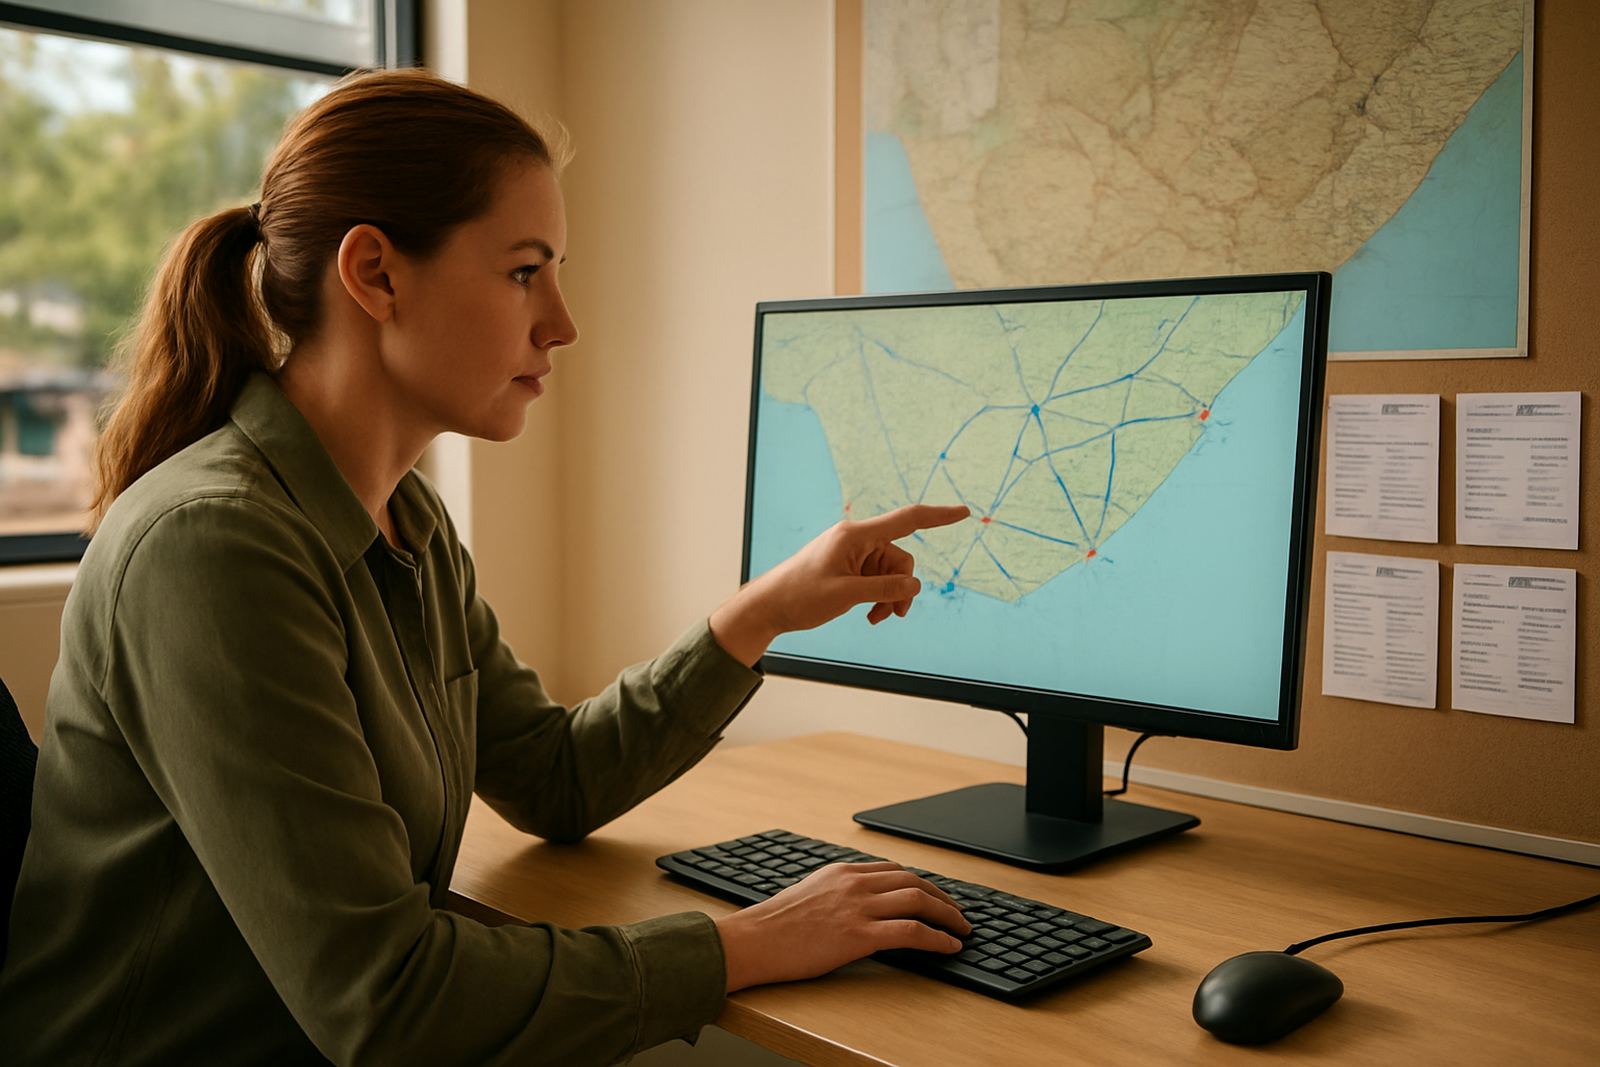




A Dashboard Must Answer Real Questions
The best dashboards are built around the questions managers ask every week, not around whatever data happens to be available. A director in Centurion may want to know which invoices are overdue, while a branch manager in Durban may need to see stock movement and open sales orders before the day starts. If the screen cannot answer those questions in a few seconds it is probably too busy.
Useful dashboards are decision tools. They should point to action, such as re-order stock, follow up a customer payment, or check whether a workflow is stuck. Anything else is just decoration and it quickly loses trust.
- Show the few figures that drive action
- Use plain labels that match the business process
- Group data by branch, product line or team where needed
- Make exceptions obvious so people know where to look first
Trust Starts With Clean Data And Clear Rules
A dashboard is only as good as the data behind it. If sales are entered late, stock movements are not updated, or staff use different naming conventions, the numbers will drift and people stop relying on the screen. Once that happens, even the best layout will not help.
That is why process mapping and data migration matter before the first chart goes live. You need one set of rules for customer names, account codes, warehouse locations and date formats. In a business with sites in Pretoria and Gqeberha, even something simple like how a branch is recorded can make reporting messy if the rules are not clear.
- Agree on one source of truth for each metric
- Set update times so users know how fresh the data is
- Remove duplicate fields and old manual trackers
- Test the figures against source documents before rollout
What Good Dashboards Show For SMEs
Small and medium businesses do not need 20 screens full of charts. They need a short list of measures that reflect how the business actually runs. A trading company in Johannesburg may care about stock cover and debtor days. A service business in Cape Town may want job progress, time spent and pending approvals. The dashboard should fit the rhythm of the business.
For many South African SMEs, the most useful views are practical ones that help with cash flow and delivery. Managers often want to see what is due today, what is late, and where the bottlenecks are. During load-shedding or month-end pressure, that quick view can save an afternoon of follow up calls and guesswork.
- Sales by branch, rep or product group
- Open purchase orders and delayed supplier deliveries
- Outstanding invoices and ageing debtors
- Stock on hand, low stock alerts and movement trends
- Work orders, task status or project milestones
Design For Speed, Not For Impressing People
Busy screens make people work harder than they should. Charts that use too many colours, tiny fonts or mixed time periods usually create more questions than answers. The goal is not to show everything at once. The goal is to make the main issue easy to spot.
Simple layout choices make a big difference. Put the most important figures at the top, keep filters easy to use, and avoid hidden logic that only one person understands. If a supervisor in the West Rand cannot read the screen in under a minute, the design needs work.
- Keep headings short and direct
- Use consistent date ranges and currency formats
- Highlight only exceptions, not every normal value
- Allow branch and department filters without extra steps
Local Example: From Spreadsheet Chasing To Real Control
Consider a mid-sized distributor with operations in Centurion, Pretoria and Durban. Before better reporting, the team spent most mornings stitching together spreadsheets from sales, stores and finance. By the time the figures were checked, the day was already moving and managers were reacting late. A few numbers were copied twice, some were missing, and no one fully trusted the totals.
After mapping the processes and linking the main systems, the business moved to a dashboard that showed orders waiting for dispatch, overdue accounts, stock below minimum level and branch performance in one place. The change was not about fancy graphics. It was about giving each manager a clear next step. Within a short time, meetings became shorter and follow-up was more focused.
That kind of improvement is common when the dashboard is built around how people actually work. It is also why user training matters. If the team does not know how to read the screen or update the source records, the dashboard will slowly lose value.
The Questions To Ask Before You Approve Any Dashboard
Before signing off on a dashboard, ask whether it supports daily decisions or just reports history. Then check whether the figures are current, whether the business rules are agreed and whether the screen will still be useful when staff change. A good dashboard should be easy to explain and easy to maintain.
For SMEs across South Africa, from East Rand factories to Cape Town offices, the most practical dashboards are the ones that save time, flag risk early and show where action is needed. If users trust the numbers, they will use the dashboard. If they do not, it becomes another tab nobody opens.
- Does it answer the top five questions your managers ask?
- Are the numbers linked to verified source data?
- Can staff use it during busy periods without extra help?
- Does it support the way your branches and teams actually operate?