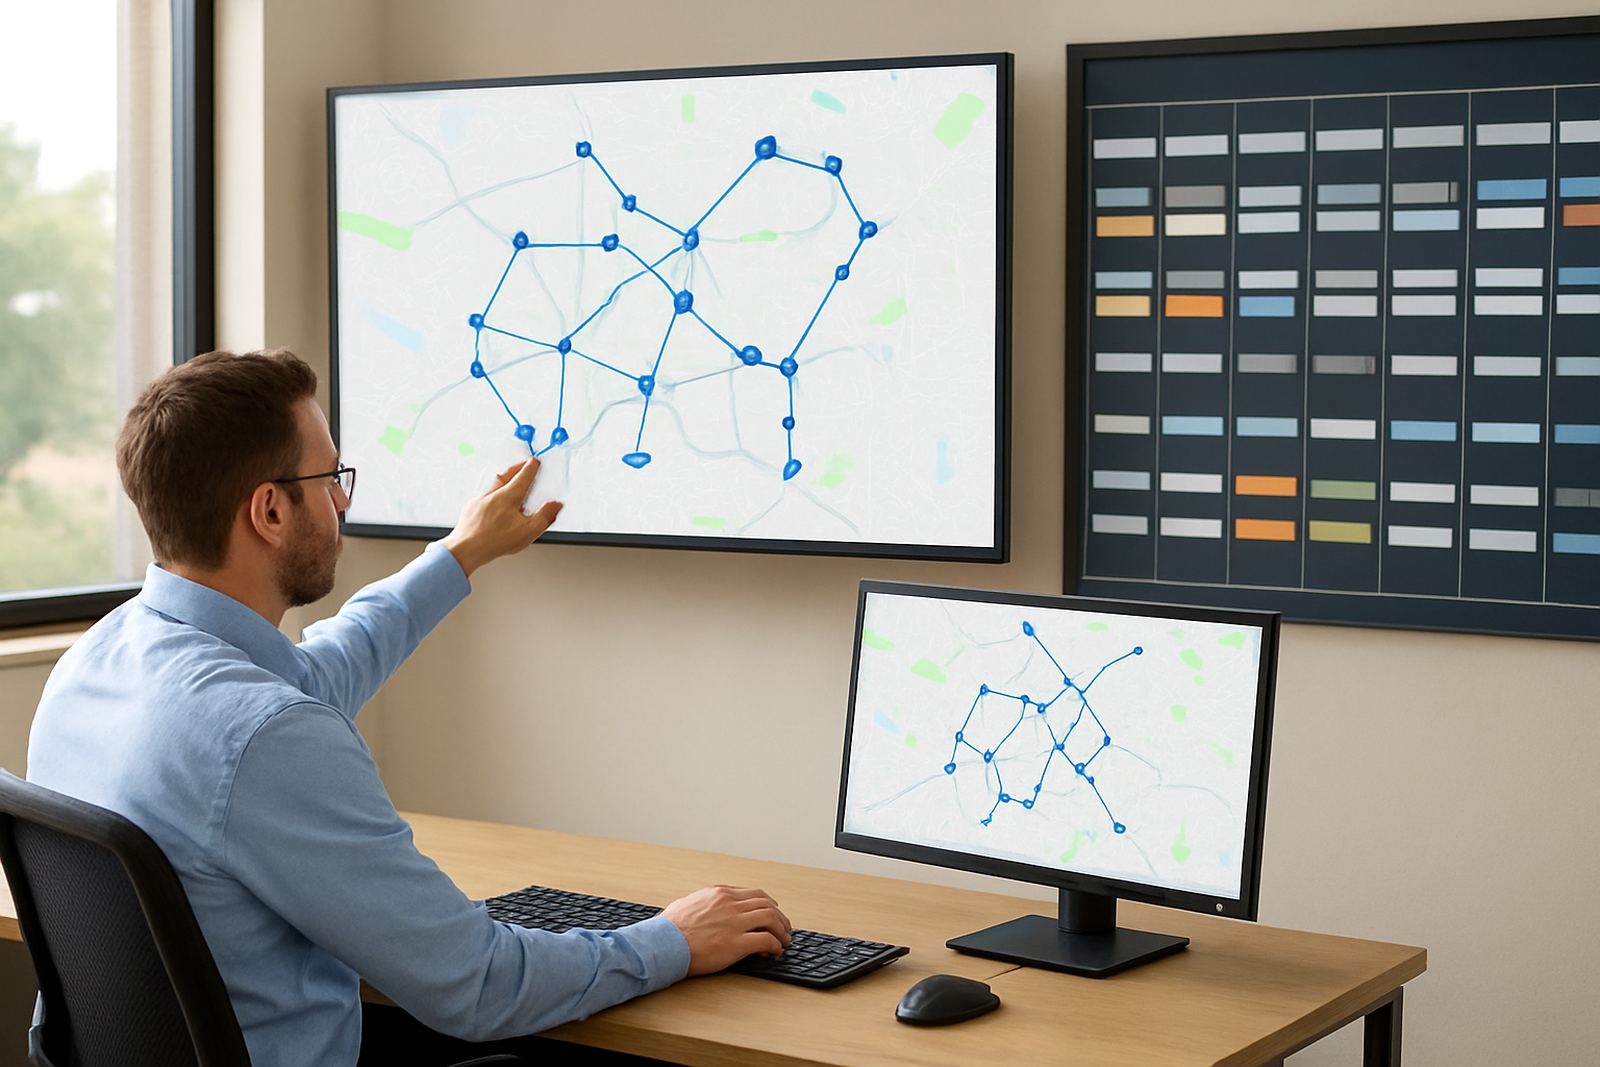




What dashboards and KPI views do in day to day operations
Dashboards and KPI views turn live business data into practical screens that managers and staff can use without digging through spreadsheets. For a Centurion office, a Johannesburg warehouse, or a Durban branch working around load-shedding, that means faster checks on orders, overdue accounts, stock movement and delivery performance. The aim is simple: one place to see what is up, what is slipping and what needs action today.
Bizmatics designs these views around the way your team already works. That may include sales pipelines, production counts, service tickets, stock cover, receivables, or branch performance. The screens can be built for tablets, laptops and large monitors, with role based access so each person sees the figures that matter to them.
Dashboard options for different teams and reporting needs
Not every business needs the same setup. Some want a single executive dashboard with 8 to 12 core measures. Others need separate views for finance, operations, procurement and customer service. We map the layout to your process and the number of users, so the system stays quick to read and easy to maintain.
- Executive summary dashboards for owners and senior management
- Department dashboards for sales, finance, operations and support
- Branch dashboards for multi-site businesses in Gauteng, KZN and the Western Cape
- Mobile-friendly views for managers on the road or on site
- Large-screen wallboard layouts for control rooms and operations floors
For small teams, a single dashboard may be enough. For a growing SME with several branches, we normally recommend a layered setup with high-level KPIs on top and drill-down views below. This keeps the information useful without overwhelming people.
Where dashboard reporting suits best
Dashboard reporting suits businesses that need quick decisions based on current data, not month-end summaries. It is particularly useful where stock changes often, billing cycles are tight, or service teams need clear operational visibility. In areas like Pretoria, East Rand, West Rand and Gqeberha, clients often use it to monitor branch throughput, stock levels and customer turnaround times.
It also helps when different systems hold different parts of the picture. If your accounting, sales, warehouse and project tools do not speak to each other yet, a dashboard can bring the key figures together in one place. That makes it easier to track margin, identify delays and spot rework before it becomes costly.
- Retail and wholesale operations
- Field service and maintenance teams
- Light manufacturing and assembly
- Distribution and logistics businesses
- Professional services and project based firms
Installation, access and power requirements
Dashboard setup usually starts with a short discovery session, then we define the figures, the refresh timing and the users who need access. In most cases the dashboard is linked to your ERP and connected systems through secure integration, with refresh intervals set according to how often the source data changes. Some clients want near real time updates, while others are fine with every 15 minutes or hourly updates.
For installation, you need a stable internet connection, user devices and access rights to the systems being connected. If dashboards will be shown on wall screens, you will also need a suitable monitor or TV and a small media device or PC. No gas supply is required. Because some sites in South Africa face outages and voltage dips, we recommend backup power for the server, network gear and display points where the dashboard must stay visible during load-shedding. In coastal towns like Cape Town or Durban, keep hardware in a dry, ventilated area to reduce damage from humidity.
Care, servicing and keeping figures trustworthy
Dashboards only stay useful if the source data remains clean. That means routine checks on master data, user permissions, posting rules and integration health. If a team changes a code structure, loads duplicate records or stops updating a process, the dashboard can quickly start showing misleading results. We help clients put simple checks in place so the numbers stay dependable.
Servicing normally includes dashboard reviews, formula checks, new KPI setup, and updates after business changes such as a new branch, a new product line or an updated workflow. Many clients also choose a support retainer so they can request small changes without waiting for a full project cycle.
- Check source data quality every month
- Review KPI definitions when processes change
- Test user access after staff changes
- Confirm integration jobs are running as expected
- Refresh report layouts for new management requirements
What to check before ordering a dashboard solution
Before you order, decide which figures are truly useful. A long list of measures can look impressive, but it often slows decision making. The best setup starts with the questions your team asks every week: Are we selling enough, are we collecting on time, where is stock tied up, and which branch is underperforming? From there, we build the dashboard around action, not vanity numbers.
You should also confirm where the data will come from, who owns each field, how often it must update and who will approve changes. If the dashboard is for management, make sure the layout is clear enough for fast reading on a laptop or large screen. If it is for floor staff, keep the count of screens low and the wording plain. A clear spec saves time and avoids back and forth later on.
- List your top 10 to 15 business measures
- Identify every source system involved
- Decide on update frequency and access levels
- Confirm whether alerts or trend indicators are needed
- Check if branch, department or company-wide views are required
Key facts
| Product type | ERP dashboard and KPI reporting module |
|---|---|
| Typical user count | 5 to 250 users, depending on licences and access rules |
| Update frequency | Real time, 15-minute, hourly or daily refresh options |
| Access devices | Laptop, benchtop, tablet and large-screen display support |
| Connectivity | Stable internet required for live data access and integration |
| Power needs | Mains power with backup recommended for key devices; no gas required |
| Deployment base | Centurion, with support across South Africa |
| Best for | SMEs needing live metrics, trends and operational visibility |